Universal Analytics trained us to read sessions and pageviews. GA4 changed the model. Everything is an event with parameters, so reports feel different, and so do the arguments. That’s the gap this guide closes. We’ll explain GA4 dimensions and metrics in plain English, show where they live in the UI, and use examples marketers actually need: landing page by channel, campaign by device, conversions by country.
You’ll see how Google Analytics metrics pair with the right dimensions to answer real questions, not trivia. Scope: web GA4 (apps follow the same rules). Fewer buzzwords, more clarity, so your dashboards lead to decisions.
GA4 data model on one page
GA4 flips the Google Analytics data model: everything is an event.
- An event records something that happened.
- A parameter adds details about that event.
- Users are people who trigger events; sessions are clusters of events within a time window.
Example: page_view
- Event: page_view
- Parameters: page_location (URL), page_referrer, page_title, session_id, device_category, source, medium
- You can add your own parameters (e.g., content_group, author).
Reports combine dimensions and metrics:
- Dimensions are descriptors pulled from parameters or lookups (e.g., Landing page, Source/Medium, Country).
- Metrics are counts/sums/ratios computed from events (e.g., Users, Sessions, Engaged sessions, Engagement rate, Conversions, Revenue). These are your GA4 metrics.
Think of it like a spreadsheet: dimensions are columns you group by; metrics are the numbers you total or average.
Where definitions live: Admin → Data display (dimensions/metrics availability, thresholds), plus Admin → Custom definitions for any parameters you register. Master this flow, event → parameters → (registered) dimension → report, and the rest of GA4 starts to click.
Dimensions vs. Metrics (and why marketers mix them up)
Dimensions describe; metrics measure. You break numbers by descriptors. In GA4, Google Analytics dimensions are labels (source, device, page). Google Analytics metrics are counts, sums, or rates.
Example (table-style in words)
- Dimension: Source/Medium → google / organic, newsletter/email
- Metrics: Sessions, Users, Engaged sessions, Engagement rate, Conversions
Reading it: “Sessions by Source/Medium,” not “Source/Medium by Sessions.” That’s metrics and dimensions working together.
Mistake to avoid
Sorting or filtering on a dimension as if it were a metric. “Landing page A > Landing page B” is meaningless unless a metric (e.g., Conversions) defines “better.” Always pair the dimension with a decision metric.
Choose the right breakdown (one tip)
Start with the business question, then pick the dimension that changes the decision.
- Content question → Landing page
- Channel performance → Session default channel group or Source/Medium
- Market prioritization → Country/Region
- UX/device fit → Device category.
If your choice doesn’t change the next action, you picked the wrong dimension.
The metrics that actually matter (for marketers)
Stop hoarding numbers. Pick a small KPI set and defend it.
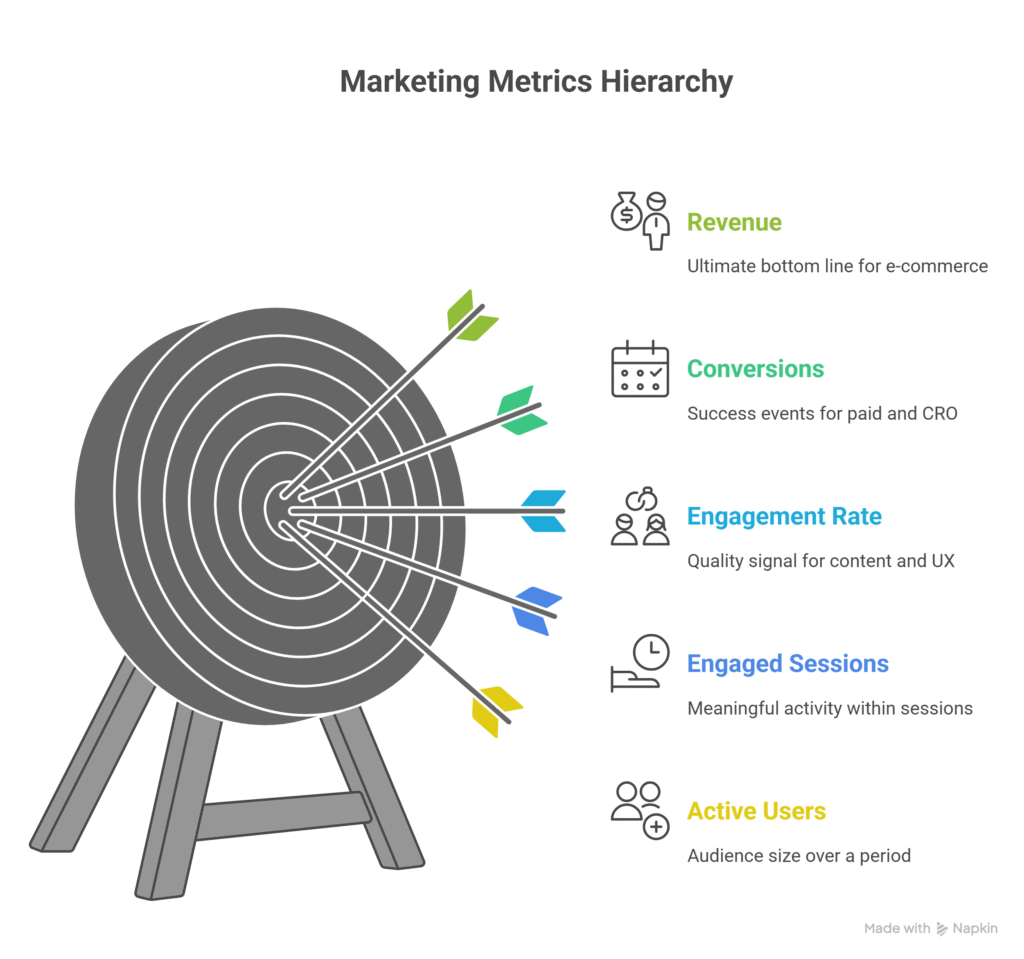
- Active Users: unique users over a period (28-day default in GA4). Good for audience size; weak for campaign proof.
- Sessions: visits grouped by activity. Useful for traffic patterns; noisy when campaigns or midnight resets start new sessions.
- Engaged Sessions: sessions with meaningful activity (≥10s active, or conversion, or ≥2 page/screen views). Stronger quality signal than raw sessions.
- Engagement Rate: engaged sessions ÷ sessions. Great for content and UX; not a revenue metric.
- Conversions: your defined success events (lead submit, purchase). Non-negotiable KPI for paid and CRO.
- Revenue: e-commerce value from events. Ultimate bottom line: for lead gen, swap in qualified leads or pipeline value.
When to favor which:
- Content/SEO → Engagement Rate, Engaged Sessions.
- Paid/Search/Email → Conversions, Revenue.
- Brand health → Active Users trend.
B2B lead gen vs. ecommerce: B2B tracks form submits → CRM quality; ecommerce ties conversions directly to order value. Keep these as your most important Google Analytics metrics and ignore the rest of the GA4 metrics noise.
High-leverage dimensions to slice by
Pick breakdowns that change decisions. These Google Analytics dimensions do.
- Source/Medium: See which acquisition pairs drive conversions, not just clicks. Use case: shift budget from display / cpc to paid social / cpc if CPA halves.
- Session default channel group: Cleaner roll-ups for exec views. Use case: compare Non-brand SEO vs Paid Search without messy UTM hygiene debates.
- Landing page + query string: Catch variant or campaign effects. Use case: A/B page versions or ?utm_campaign=summer underperforming, fix copy or speed.
- Country/Region: Localize bets. Use case: strong engagement in CA but low conversion, price in CAD, or add duties info.
- Device category: Mobile vs desktop intent gap. Use case: mobile exits on checkout, simplify fields, or enable wallets.
Limits to remember: GA4 may threshold low-volume rows and model data under consent; tiny slices can look empty or “rounded.” Don’t over-segment, pair with core Google Analytics website metrics (Users, Engaged Sessions, Conversions, Revenue), and act only when the slice changes the next move.
What is a secondary dimension in Google Analytics?
A secondary dimension adds context to your primary table. You start with one breakdown, then layer a second to explain the “why.” For example, add the Device category to a Landing page report to spot mobile-specific drop-offs, slow heroes, heavy scripts, and tiny tap targets. That’s the fastest way to turn a flat list into action.
Remember: in Google Analytics, a dimension is a descriptor (page, source, device), not a number. So a secondary dimension is simply another descriptor.
One caution: tiny rows create noisy decisions. If your added breakdown yields single-digit users or modeled/thresholded data, zoom out. Use secondary dimensions to confirm a hypothesis, not to hunt trivia. What is a secondary dimension in Google Analytics is context, not clutter.
Custom dimensions & metrics: when (and how) to define your own
Use custom fields when defaults can’t answer your business question. Classic use cases:
- Content group (Hub, BOFU, Docs) to see which topics convert.
- Logged-in status to separate prospects from customers.
- Plan tier (Free, Pro, Enterprise) for upgrade paths.
- Lead quality (MQL, SQL) to judge traffic beyond raw form fills.
How to implement Google Analytics custom dimensions (short path):
- Send a parameter with the event (e.g., content_group, plan_tier). GTM: add it to GA4 Configuration/Event; gtag: include in gtag(‘event’, …) call.
- Register it in Admin → Custom definitions → Create custom dimension/metric.
- Choose scope: event (per hit) or user (persists for that user).
- Publish and note it’s not retroactive.
For custom dimensions in Google Analytics that become KPIs (e.g., qualified leads), create custom metrics too, counts or sums tied to your parameter. That’s the essence of GA4 custom dimensions and metrics.
Validate before trusting: open Realtime/DebugView, trigger test events, confirm the parameter appears, then check a quick Exploration. Document definitions in a shared sheet (name, scope, description, example values). Good custom dimensions and metrics in GA4 are boringly consistent, and immediately answer “Which content, for which users, drove which conversions?”
Definitions marketers argue about (so you don’t have to)
What is a metric in Google Analytics?
A metric is a number you can count, sum, or rate (e.g., Users, Sessions, Conversions, Revenue). Example: “Conversions” by Source/Medium. That’s what a metric is in Google Analytics: a measurable value.
What is an active user in Google Analytics?
GA4 counts “Active Users” primarily as engaged users (users with ≥1 engaged session) within your date range; many teams align on the 28-day default. That’s your Google Analytics active users definition to standardize.
Definition of sessions in Google Analytics
A session starts with the first event and ends after 30 minutes of inactivity by default. In GA4, a new session also begins at midnight or when campaign parameters change. Lock this definition of sessions in Google Analytics in your documentation.
Bottom line: metrics are the numbers, dimensions are the labels; agree on user, session, and engagement definitions once, then stop debating and start comparing trends by the same rulebook.
Build a marketer’s KPI view (Explorations + Reports)
Create one reusable view and share it weekly.
Explorations (free-form): Rows = Landing page; Columns = Session default channel group.
Metrics = Users, Engaged sessions, Conversions, Revenue.
Add a filter to exclude tiny rows (e.g., Users < 10). Save as “KPI, Landing × Channel.” This turns metrics and reporting into one actionable grid for content and acquisition.
Standard Reports: Customize the Reports snapshot, add cards for Conversions, Engagement rate, Top landing pages, and Channels. Save a report collection named “Marketing KPIs.”
Annotation habit: Log launches, promos, and site changes on the same day (use GA4 notes/your changelog). Correlate spikes/dips to context; your Google Analytics kpi trends make sense only when launches are documented.
Pitfalls, thresholds, and QA
GA4 hides or rounds low-volume rows (thresholding) and can model data with Consent Mode. Don’t overreact to tiny slices; aggregate before deciding. Filter internal traffic early; unfiltered staff hits corrupt trends.
QA rhythm: monthly spot-checks in Realtime/DebugView, confirm tag firing on key templates, and compare directional trends to paid platforms. If Google Ads spikes while GA4 conversions don’t, investigate attribution windows and duplicates, not “analytics vs metrics” philosophy.
Standardize Google Analytics terminology in a shared doc (users, sessions, engaged sessions, conversion rules). Keep a change log: launches, tag edits, consent updates, and site releases. When numbers shift, check the log first. Trust comes from consistent definitions plus boring, repeatable checks, not from one-off fixes.
Conclusion
Learn defaults, choose a tight KPI set, then add custom only when a question demands it. Print the glossary, share with the team, and revisit GA4 dimensions and metrics regularly.
Frequently Asked Questions
In Google Analytics, what is a dimension?
What is a metric that Google Analytics tracks by default?
What is a secondary dimension in Google Analytics?
Why don’t GA4 and ad platforms match?
Can I export a GA4 dimensions and metrics list?